 CYTOTOUR
CytoTour › Cellular respiration
Cellular respiration: the steps, in 3D
Cellular respiration uses the energy in food molecules such as glucose to make ATP: C₆H₁₂O₆ + 6 O₂ → 6 CO₂ + 6 H₂O. Most of the ATP is made in mitochondria. This guide follows one glucose through every stage, ending at the real, human molecular machines of the inner mitochondrial membrane.
The stages of cellular respiration
| Stage | Where | Oxygen | Per glucose |
|---|---|---|---|
| Glycolysis | Cytoplasm | Not used directly | Net 2 ATP, 2 NADH; glucose → 2 pyruvate |
| Pyruvate oxidation | Mitochondrial matrix | — | 2 acetyl CoA, 2 CO₂, 2 NADH |
| Citric acid (Krebs) cycle | Mitochondrial matrix | Not used directly, but needed downstream | Two turns: 4 CO₂, 2 ATP, 6 NADH, 2 FADH₂ |
| Electron transport chain and chemiosmosis | Inner mitochondrial membrane | Final electron acceptor; forms water | About 90 % of the ATP, made by ATP synthase |
The total number of ATP per glucose varies; overall about 34 % of the energy in glucose is extracted.
Step by step, in 3D
These views are Chapter 5 of CytoTour, part of the Teacher plan.
Where it happens
1Energy from food
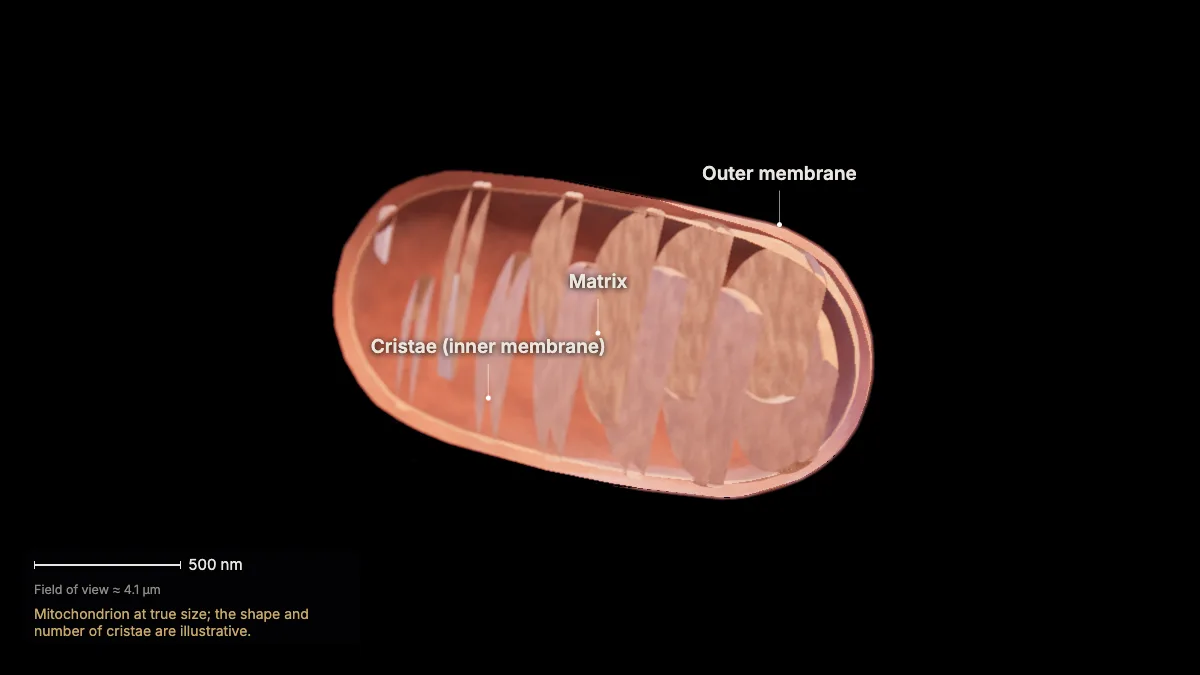
Cellular respiration uses the energy in food molecules such as glucose to make ATP.
Overall: C₆H₁₂O₆ + 6 O₂ → 6 CO₂ + 6 H₂O — glucose and oxygen in, carbon dioxide and water out, with energy captured in ATP.
The bonds of glucose and oxygen are broken and new compounds form, with a net transfer of energy.
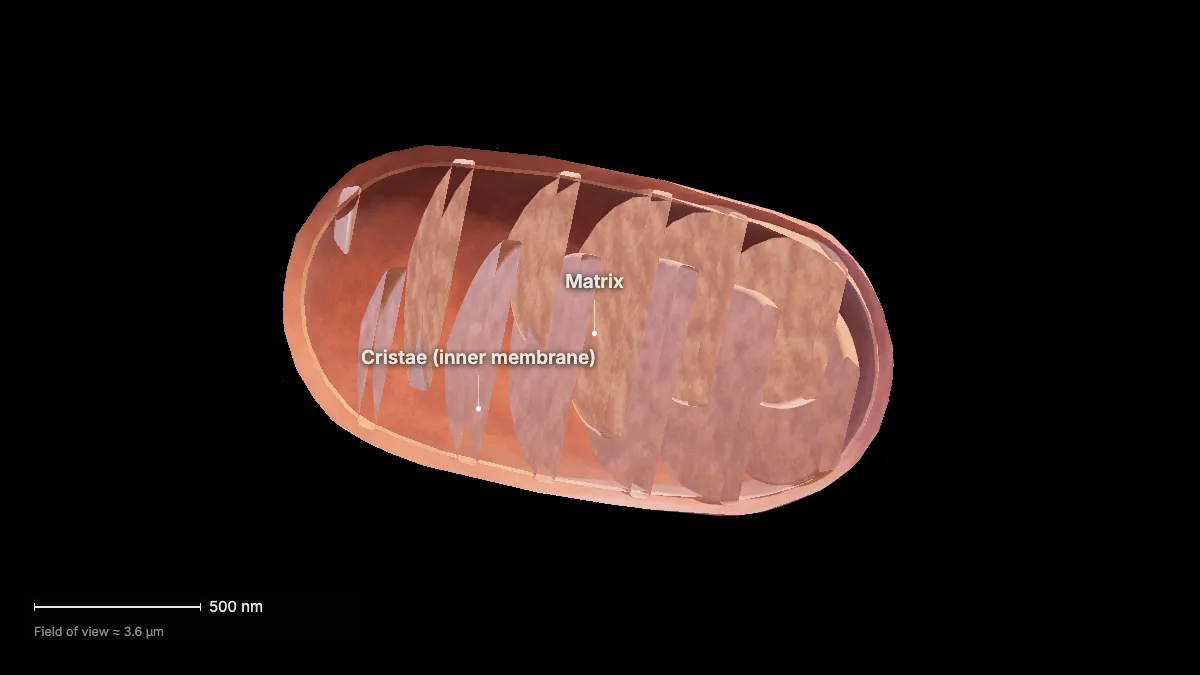
Most of the ATP is made in mitochondria — organelles with a double membrane, the inner one folded into cristae around the matrix.
- Mitochondrion≈ 1 × 2 µm
In the model: Mitochondrion at true size; the shape and number of cristae are illustrative.
Glycolysis and the citric acid cycle
2Glycolysis
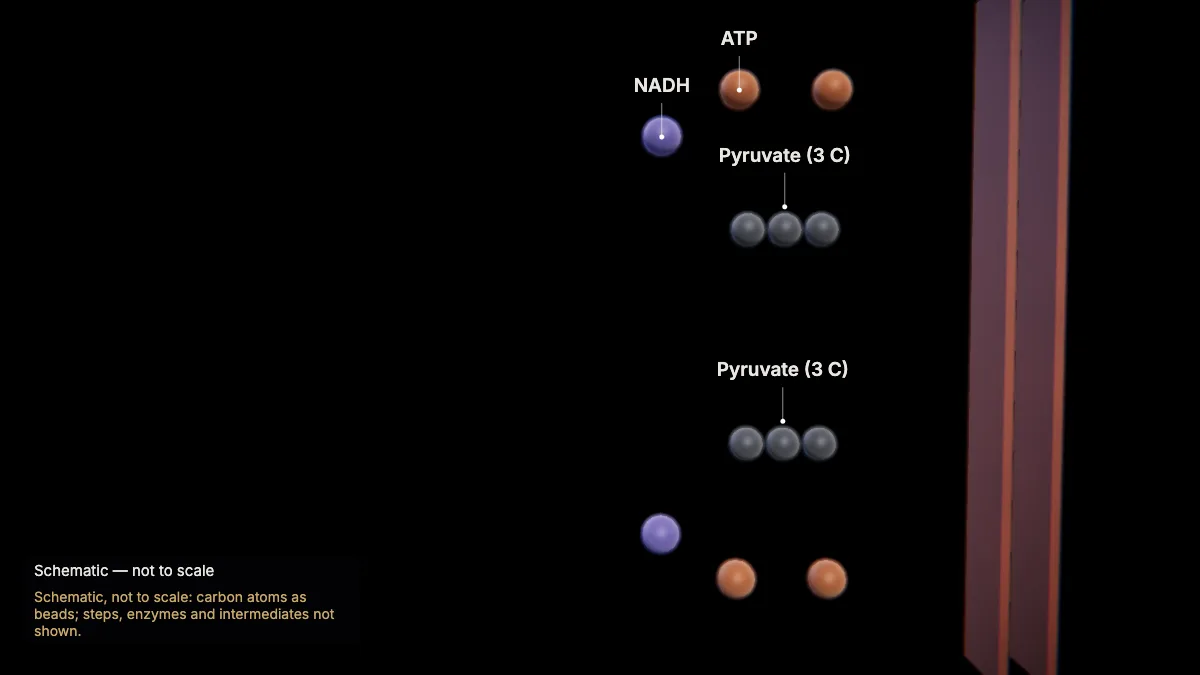
Glycolysis splits one glucose (six carbons) into two pyruvate molecules (three carbons each), in the cytoplasm.
It takes ten steps and does not use oxygen directly.
The first half uses 2 ATP; the second half makes 4 ATP and 2 NADH — a net gain of 2 ATP and 2 NADH.
These ATP are made by substrate-level phosphorylation: a phosphate group moves straight from an intermediate to ADP.
- Net per glucose2 ATP · 2 NADH
In the model: Schematic, not to scale: carbon atoms as beads; steps, enzymes and intermediates not shown.
3Into the mitochondrion
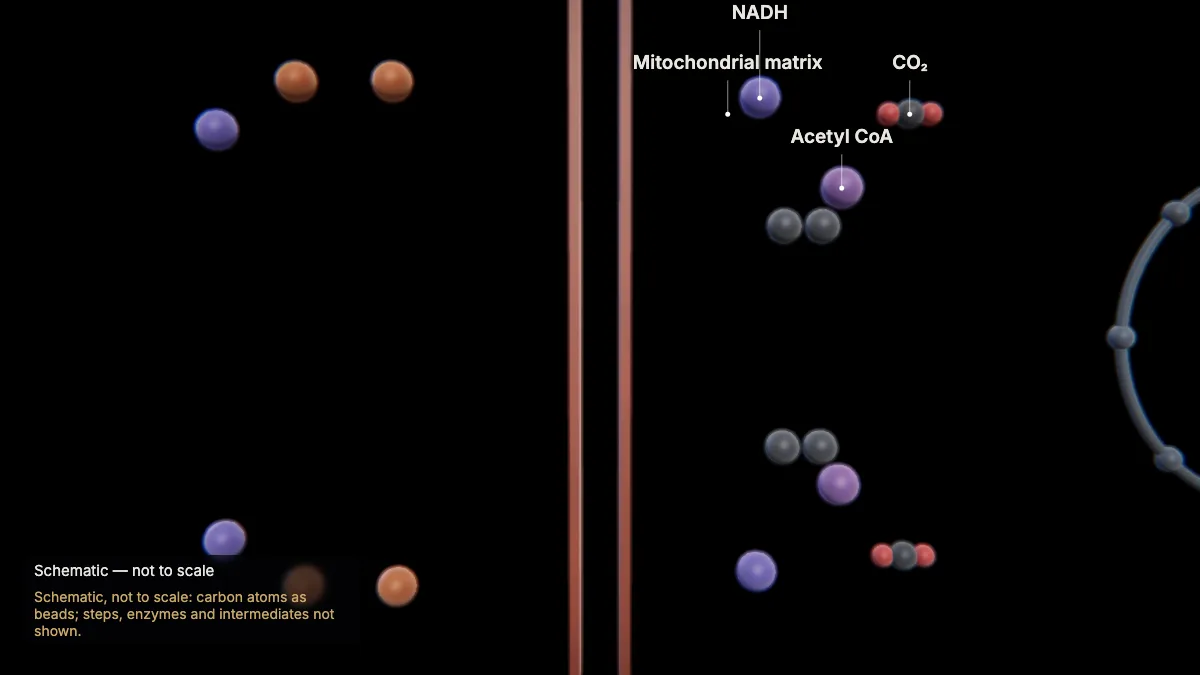
Each pyruvate is carried into the mitochondrion. In the matrix it becomes acetyl CoA, releasing one CO₂ and making one NADH.
NAD⁺ becomes NADH by accepting two electrons and a proton — NADH carries energy-rich electrons onward.
One glucose gives two pyruvates, so this happens twice for each glucose.
In the model: Schematic, not to scale: carbon atoms as beads; steps, enzymes and intermediates not shown.
4The citric acid cycle
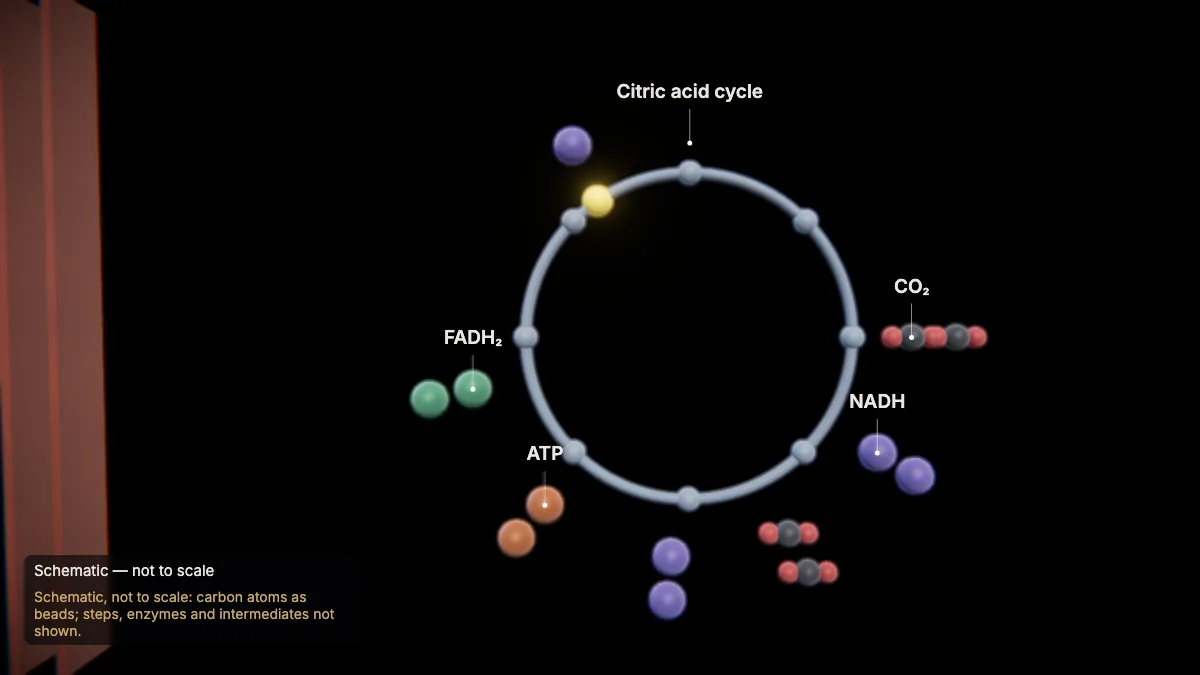
In the matrix, the citric acid cycle (Krebs cycle) breaks the acetyl group down, releasing its carbon as CO₂.
Each turn releases 2 CO₂ and makes 1 ATP, 3 NADH and 1 FADH₂. One glucose gives two acetyl groups, so the cycle turns twice.
It uses no oxygen directly, yet it is aerobic: its NADH and FADH₂ must hand their electrons to a system that uses oxygen.
- Per turn2 CO₂ · 1 ATP · 3 NADH · 1 FADH₂
- Turns per glucose2
In the model: Schematic, not to scale: carbon atoms as beads; steps, enzymes and intermediates not shown.
The electron transport chain
5The inner membrane
NADH and FADH₂ carry their electrons to the electron transport chain, built into the inner mitochondrial membrane.
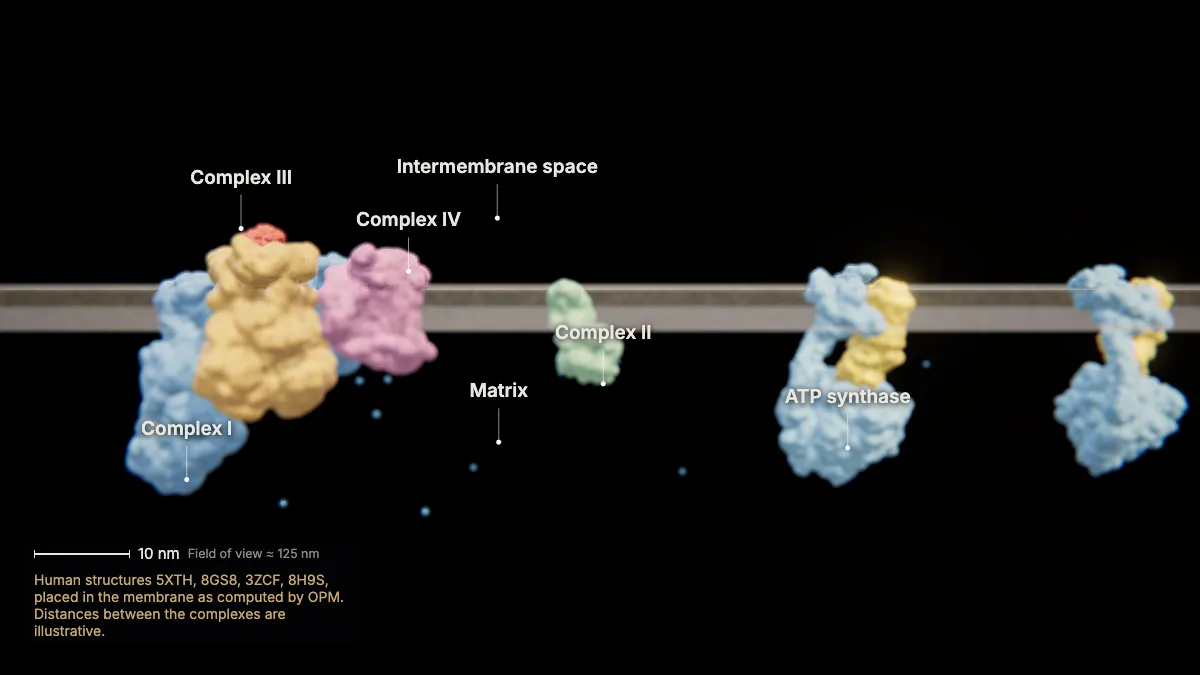
Complexes I–IV, the carrier cytochrome c and, beside them, ATP synthase are shown at true size, from human structures.
The folds of the inner membrane — the cristae — add surface area, so more ATP can be made.
- Complex I≈ 29 nm long
- Membrane≈ 4 nm thick
In the model: Human structures 5XTH, 8GS8, 3ZCF, 8H9S, placed in the membrane as computed by OPM. Distances between the complexes are illustrative.
6NADH gives up its electrons
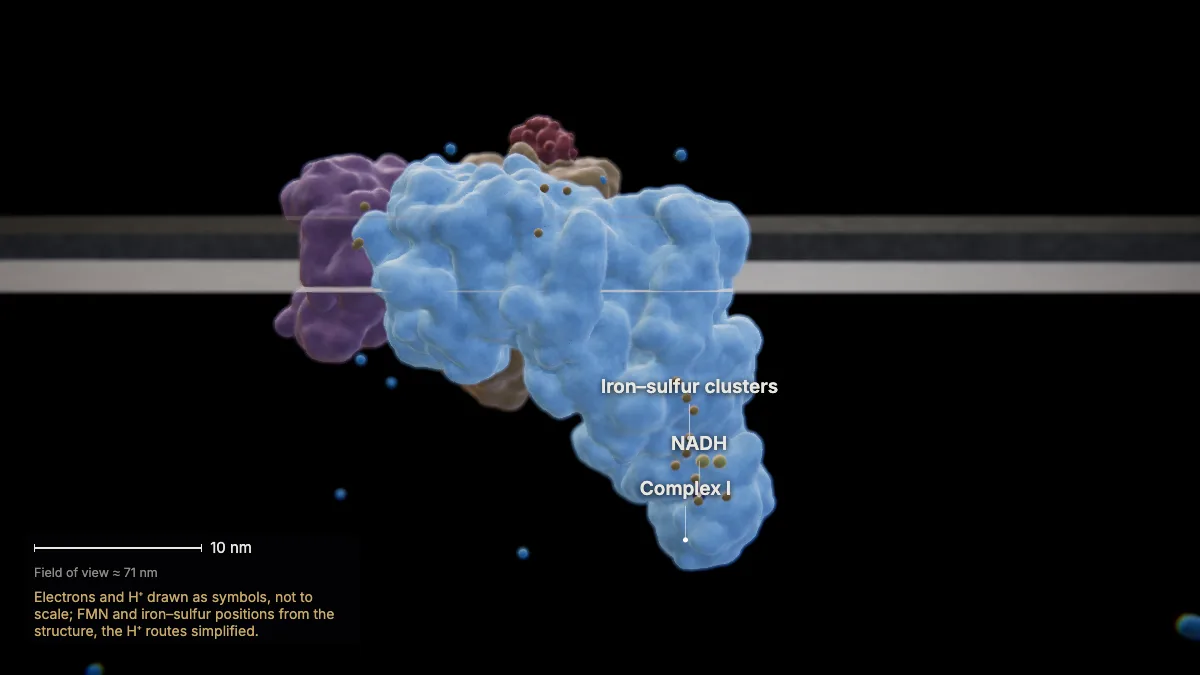
NADH hands two electrons to complex I. Inside, they pass through FMN and a chain of iron–sulfur clusters toward the membrane.
As the electrons move through, complex I pumps four hydrogen ions (H⁺) from the matrix into the intermembrane space.
At the membrane, complex I passes the electrons to ubiquinone (Q).
In the model: Electrons and H⁺ drawn as symbols, not to scale; FMN and iron–sulfur positions from the structure, the H⁺ routes simplified.
7FADH₂ enters at complex II
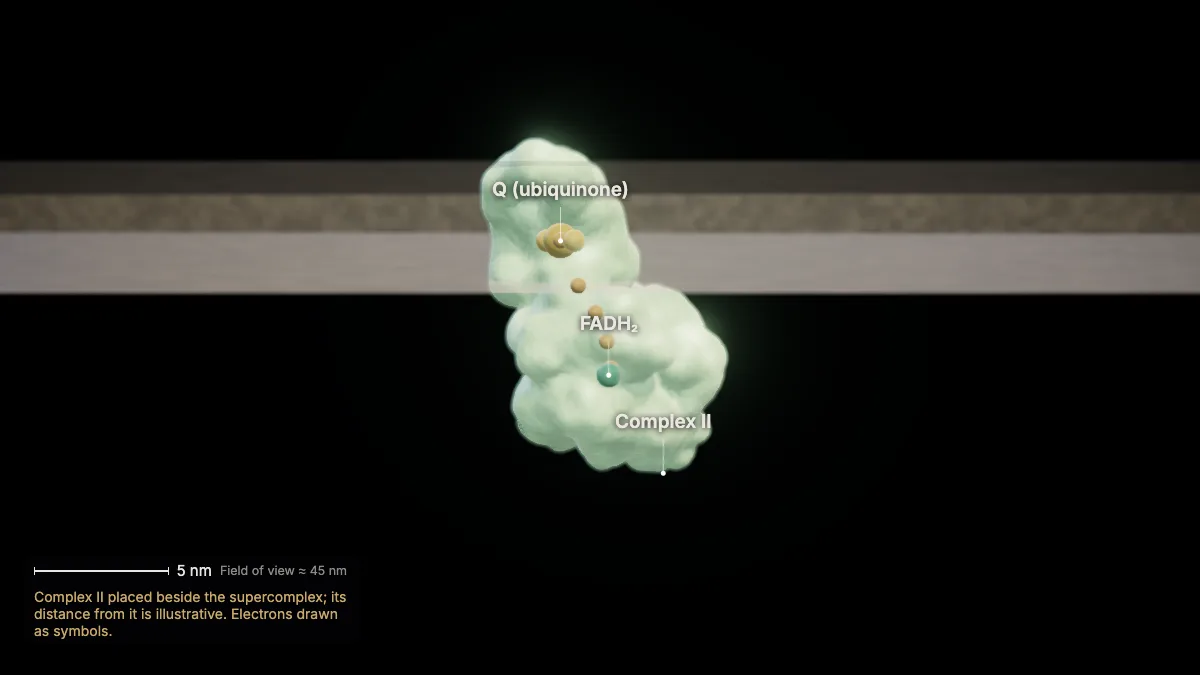
FADH₂ hands its electrons to complex II, which also passes them to Q — skipping complex I.
Because these electrons bypass complex I, fewer protons are pumped for each FADH₂ than for each NADH.
Complex II is succinate dehydrogenase: the one enzyme of the citric acid cycle embedded in the inner membrane.
In the model: Complex II placed beside the supercomplex; its distance from it is illustrative. Electrons drawn as symbols.
8Q and cytochrome c
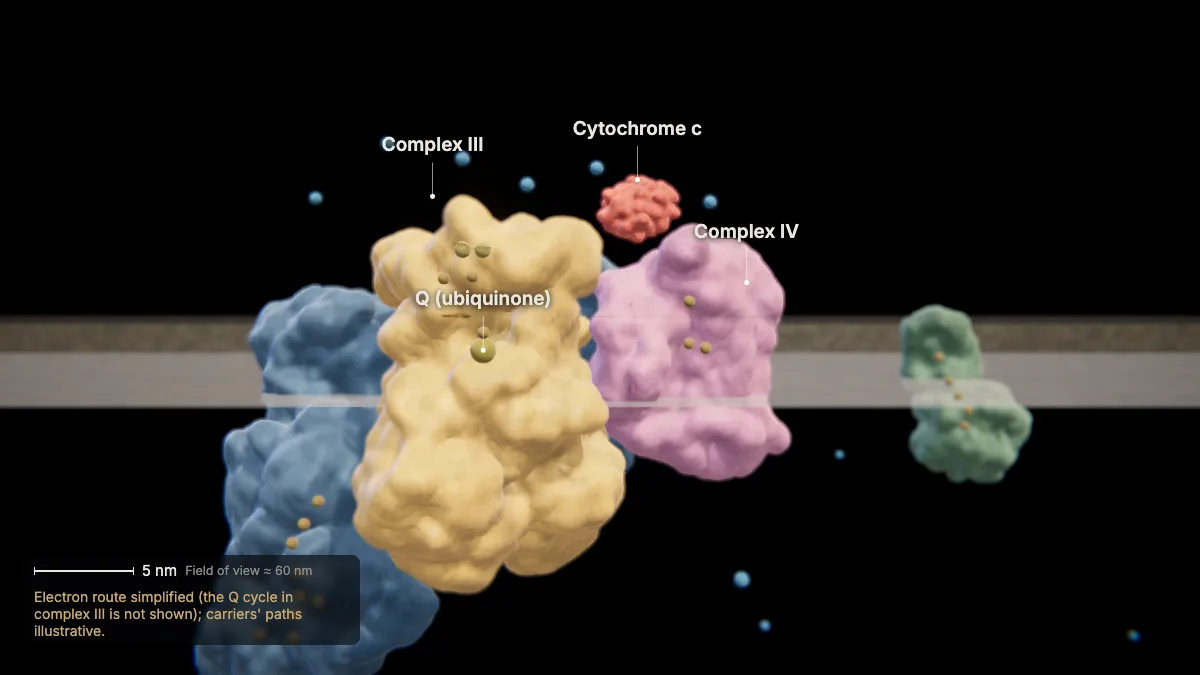
Q carries the electrons through the membrane to complex III; cytochrome c then carries them to complex IV, one at a time.
Each hand-over is an oxidation–reduction reaction: one carrier loses electrons (is oxidized), the next gains them (is reduced).
Energy released along the chain keeps pumping protons into the intermembrane space.
In the model: Electron route simplified (the Q cycle in complex III is not shown); carriers' paths illustrative.
9Oxygen, the final acceptor
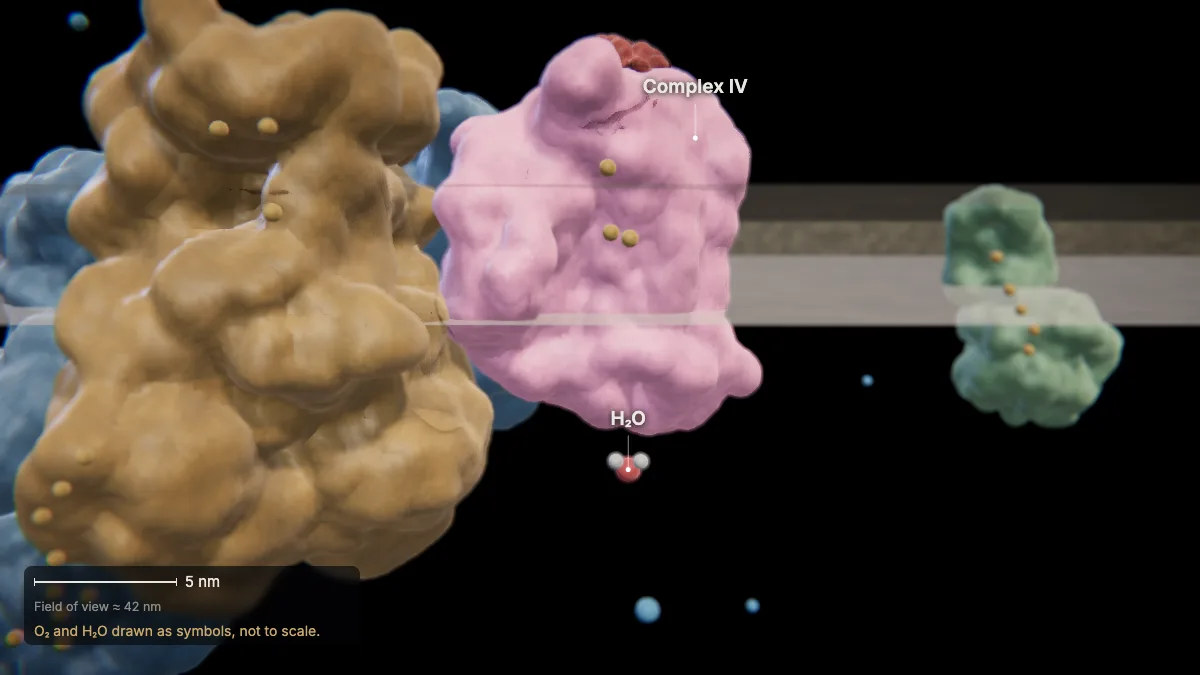
At complex IV, oxygen accepts the electrons — the final electron acceptor — and combines with hydrogen ions to form water.
This is the water in the overall equation.
In the model: O₂ and H₂O drawn as symbols, not to scale.
10A proton gradient
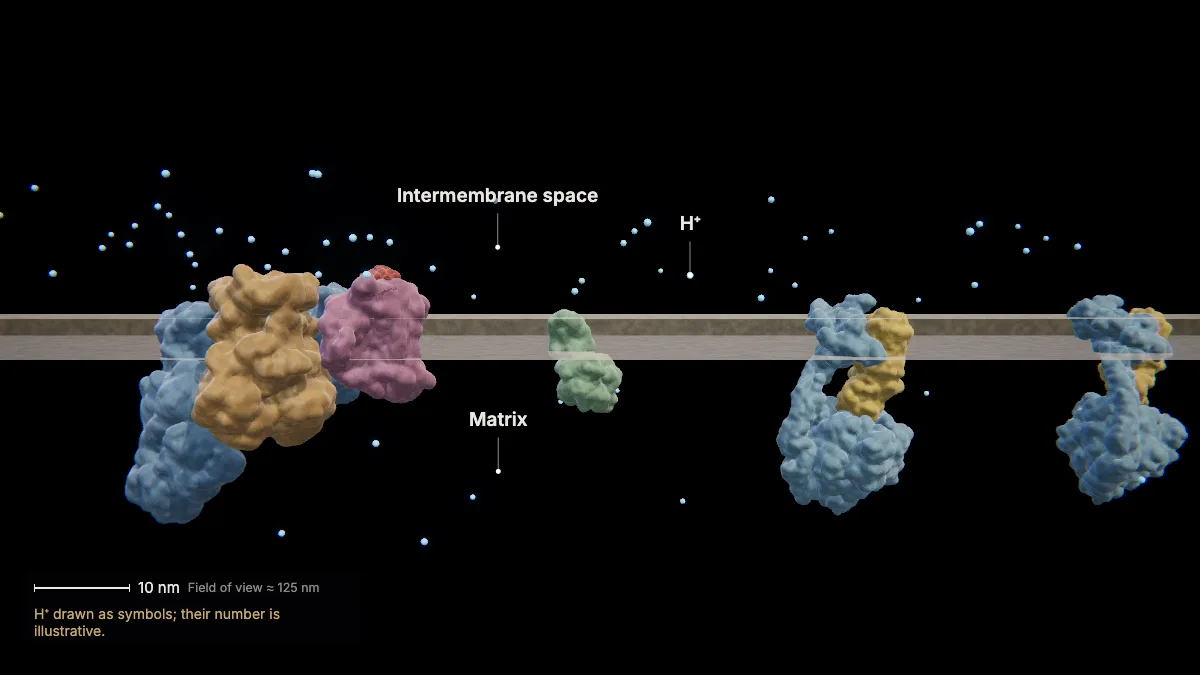
The pumped protons build up in the intermembrane space — a concentration and an electrical gradient across the inner membrane.
The matrix is left with fewer H⁺, so its pH is higher than in the intermembrane space.
In the model: H⁺ drawn as symbols; their number is illustrative.
ATP synthase and chemiosmosis
11ATP synthase
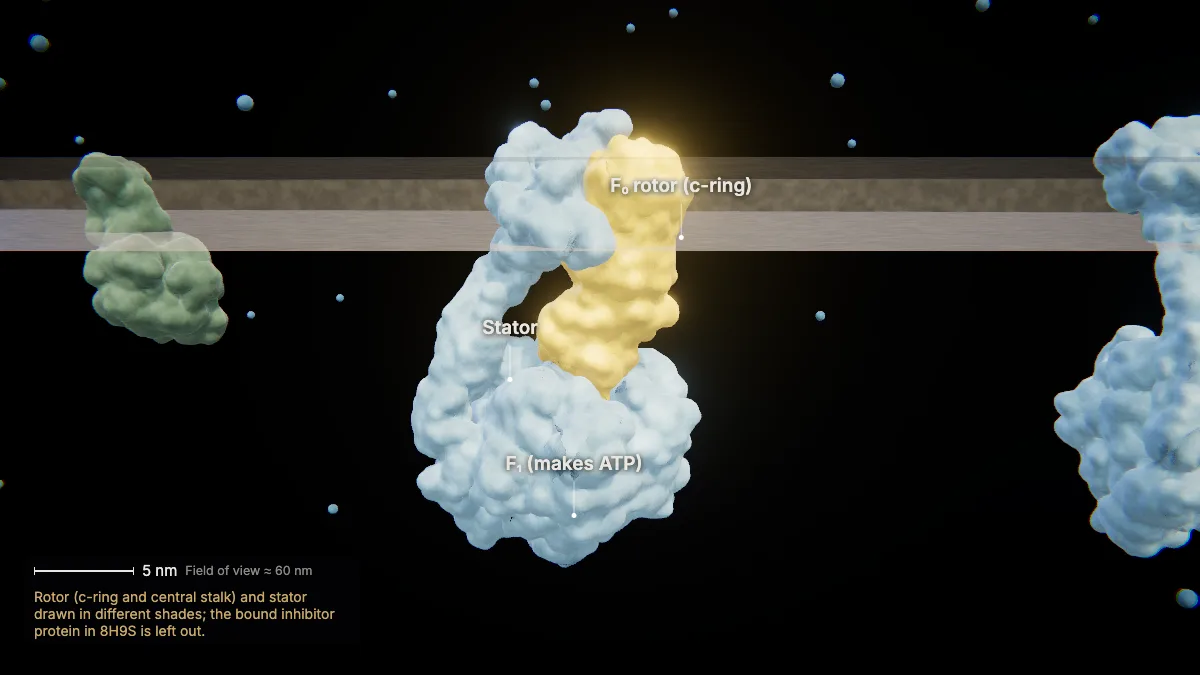
Protons can flow back only through ATP synthase. Its F₀ part sits in the membrane; its F₁ head sticks into the matrix.
F₀ includes a ring of c-subunits — eight in human ATP synthase. A central stalk links the ring to F₁; a peripheral stalk (the stator) holds F₁ in place.
This human ATP synthase (PDB 8H9S) is about 24 nm long.
- c-ring8 subunits
- Length (PDB 8H9S)≈ 24 nm
In the model: Rotor (c-ring and central stalk) and stator drawn in different shades; the bound inhibitor protein in 8H9S is left out.
12Protons turn the rotor
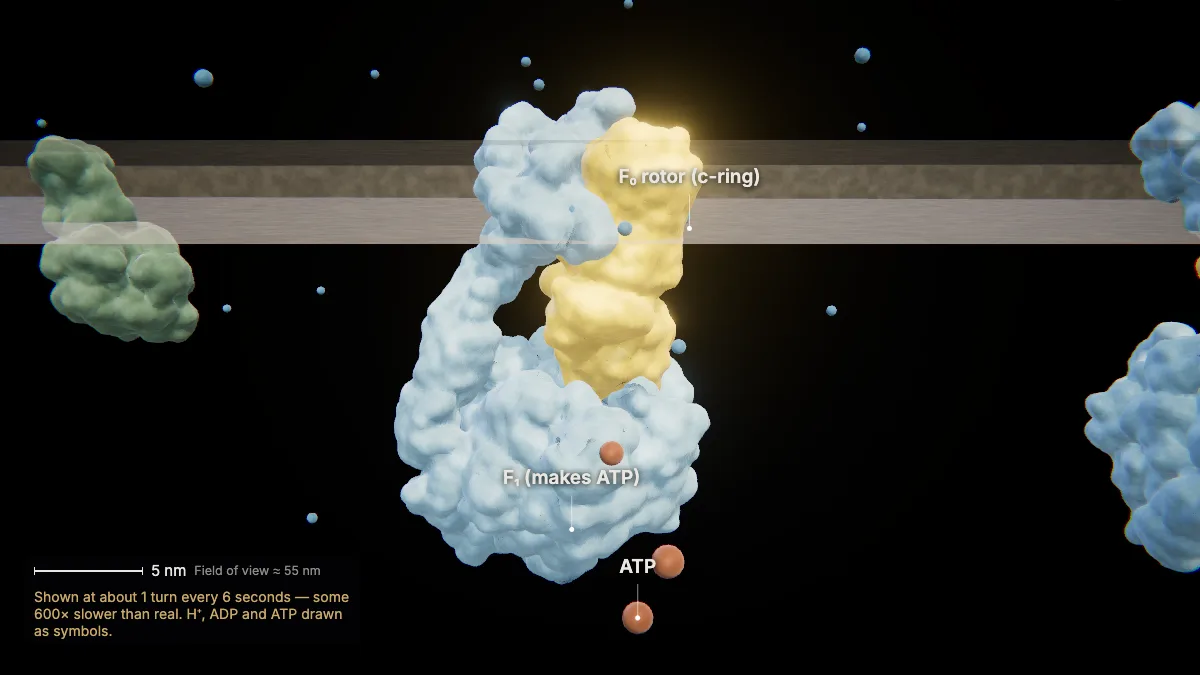
Protons flowing back through F₀ turn the rotor; each full turn makes three ATP from ADP and phosphate in F₁.
This is chemiosmosis — oxidative phosphorylation.
One turn takes 8 protons, about 2.7 per ATP. The real rotor turns about 100 times per second.
In the model: Shown at about 1 turn every 6 seconds — some 600× slower than real. H⁺, ADP and ATP drawn as symbols.
13How much ATP?
Glycolysis nets 2 ATP and the citric acid cycle 2 more; most of the ATP — about 90 % — comes from chemiosmosis.
The exact total per glucose varies. Overall, about 34 % of the energy in glucose is extracted.
- Glycolysis (net)2 ATP
- Citric acid cycle2 ATP
- Chemiosmosis≈ 90 % of the ATP
Without oxygen
14Without oxygen: fermentation
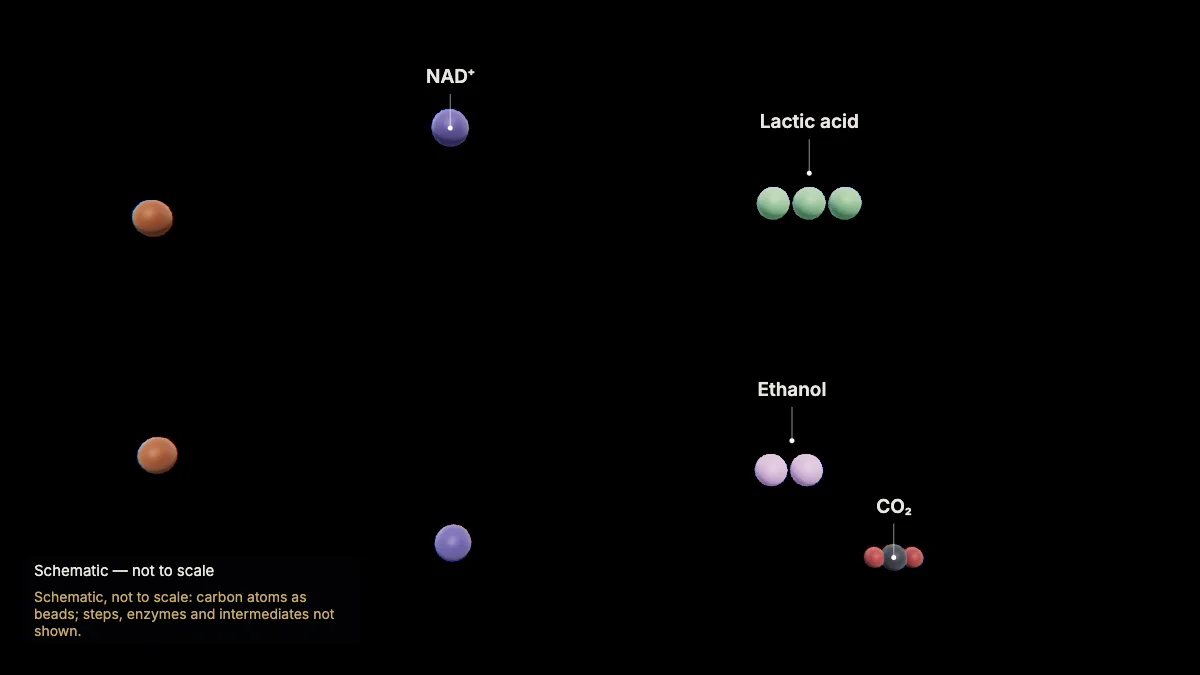
Without oxygen, fermentation turns NADH back into NAD⁺ so glycolysis can keep going — for just 2 ATP per glucose.
Muscle cells short of oxygen, and red blood cells, which have no mitochondria, make lactic acid.
Yeast make ethanol and release CO₂ — alcohol fermentation.
Respiration and fermentation are found in all forms of life.
In the model: Schematic, not to scale: carbon atoms as beads; steps, enzymes and intermediates not shown.
For teachers
This chapter covers NGSS HS-LS1-7 (cellular respiration as a chemical process with a net transfer of energy) and AP Biology Topic 3.5 (cellular respiration).
- Project the 3D model and go step by step, with labels and an English voice-over you can turn on or off.
- Checkpoints pause the lesson for a question: predict before a step, or check after it.
- Record a lesson video right from the page, or export an MP4.
- Simplifications are stated on screen, and the scale bar is measured from the actual view.
Chapter 1, the tour of the cell, is free for everyone. The Teacher plan adds the next chapters — transcription, translation, protein folding and secretion, cellular respiration, and the cell cycle and mitosis — plus 4K video exports without a watermark: $29 a year during early access (regular price $69).
What the model simplifies
- Glycolysis, pyruvate oxidation, the citric acid cycle and fermentation are schematic maps (carbon atoms as beads), not to scale; steps, enzymes and intermediates are not shown.
- In the membrane views, the protein structures are human and at true size, placed in the membrane as computed by the OPM database; the distances between complexes are illustrative.
- Electrons, protons and small molecules are drawn as symbols; the Q cycle in complex III is not shown.
- ATP synthase is shown turning far slower than its roughly 100 turns per second.
Sources
- OpenStax, Biology 2e, §7.1–7.5 Cellular Respiration — openstax.org
- OpenStax, Concepts of Biology, §4.1 Energy and Metabolism — openstax.org
- College Board, AP Biology Course and Exam Description, Topic 3.5 — apcentral.collegeboard.org
- NGSS HS-LS1-7 — nextgenscience.org
- Watt et al., Bioenergetic cost of making an ATP molecule in animal mitochondria, PNAS 107 (2010) — doi.org
- RCSB PDB-101, Molecule of the Month: ATP Synthase — pdb101.rcsb.org
- Protein Data Bank structures 5XTH, 8GS8, 3ZCF, 8H9S — rcsb.org
- OPM — Orientations of Proteins in Membranes — opm.phar.umich.edu