 CYTOTOUR
CytoTour › Enzymes
Enzymes: how they work, in 3D
Enzymes are biological catalysts: they speed up the reactions of the cell by lowering the activation energy. This guide shows how, on real human enzymes at true size — glucokinase closing around glucose, and a cholesterol-lowering statin blocking the active site of HMG-CoA reductase.
What affects an enzyme's activity
| Factor | Effect |
|---|---|
| Temperature | The rate rises with temperature up to the optimum (more collisions); too hot, the enzyme denatures |
| pH | Each enzyme works best in a certain pH range; outside it, its shape and active site change |
| Substrate concentration | The rate rises with substrate concentration up to a maximal rate |
| Competitive inhibitor | Binds the active site and blocks the substrate (e.g. statins) |
| Noncompetitive inhibitor | Binds elsewhere (an allosteric site) and lowers the maximal rate |
| Allosteric activator | Binds away from the active site and increases its affinity for the substrate |
| Cofactors and coenzymes | Ions (Mg²⁺, Fe²⁺, Zn²⁺) and organic helpers, often from vitamins, that many enzymes need |
Step by step, in 3D
These views are Chapter 10 of CytoTour, part of the Teacher plan.
Catalysts
1Enzymes lower the barrier
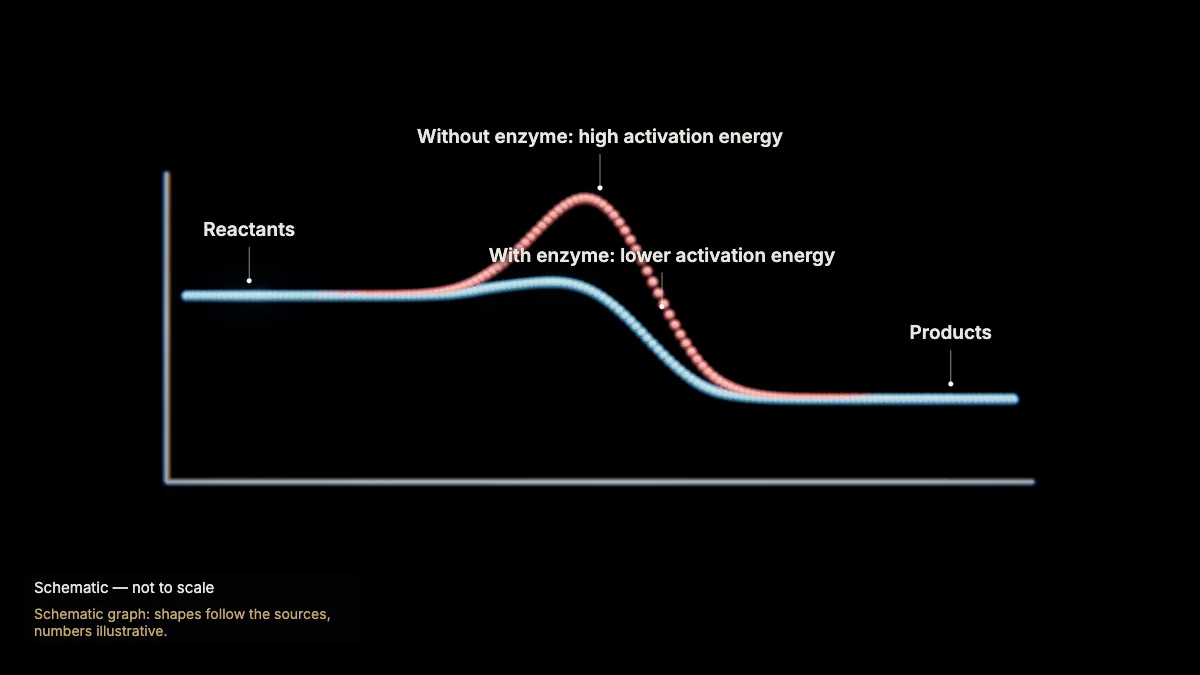
Every reaction needs an energy input — the activation energy — to reach its transition state. Enzymes speed reactions up by lowering it.
The higher the activation energy, the slower the reaction; heat alone cannot get most cellular reactions going fast enough.
An enzyme does not change whether a reaction releases or takes in energy. Enzymes are biological catalysts — almost all of them proteins.
In the model: Schematic graph: shapes follow the sources, numbers illustrative.
The active site and induced fit
2A real enzyme: glucokinase
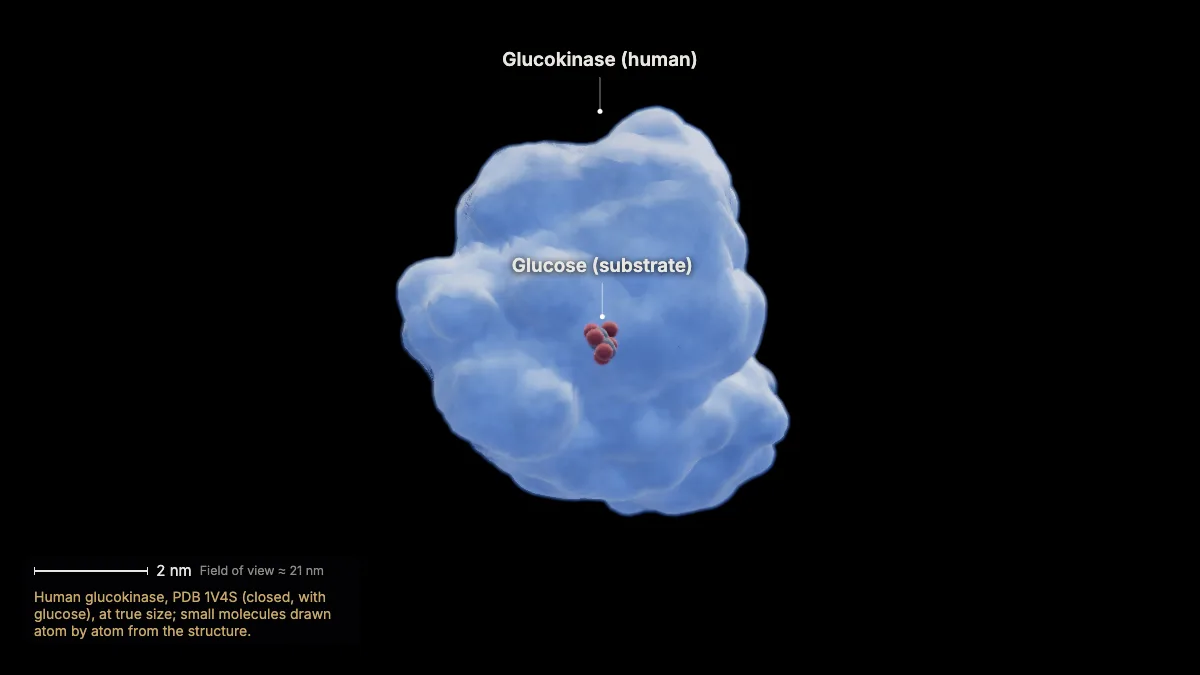
This is human glucokinase, at true size. It adds a phosphate from ATP to glucose, making glucose 6-phosphate.
It works mainly in the liver and in the insulin-making β cells of the pancreas, and it binds glucose only weakly.
- Glucokinase (1V4S)≈ 7 nm across
In the model: Human glucokinase, PDB 1V4S (closed, with glucose), at true size; small molecules drawn atom by atom from the structure.
3The active site
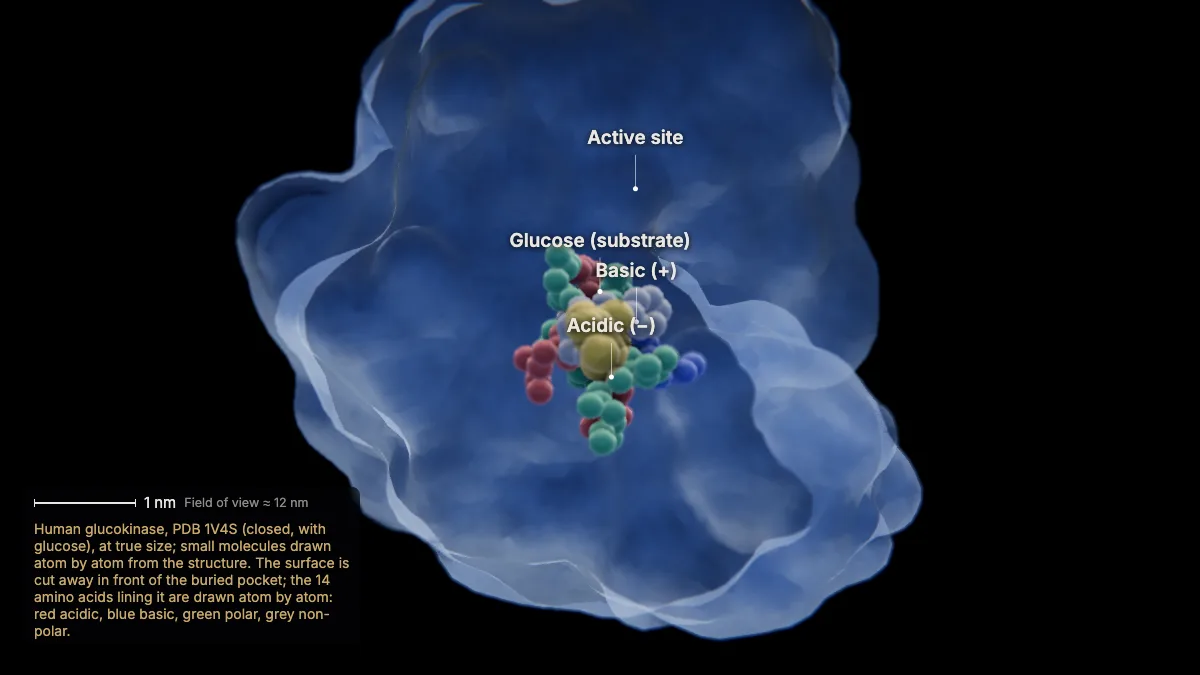
Glucose binds in the active site, a pocket whose shape and charge match it: the enzyme–substrate complex.
The pocket is lined by amino acid side chains — acidic, basic, polar and non-polar — that make a chemical environment found nowhere else. That is why an enzyme is specific for its substrate.
In this structure, 14 amino acids touch the glucose, several of them charged.
In the model: Human glucokinase, PDB 1V4S (closed, with glucose), at true size; small molecules drawn atom by atom from the structure. The surface is cut away in front of the buried pocket; the 14 amino acids lining it are drawn atom by atom: red acidic, blue basic, green polar, grey non-polar.
4Induced fit
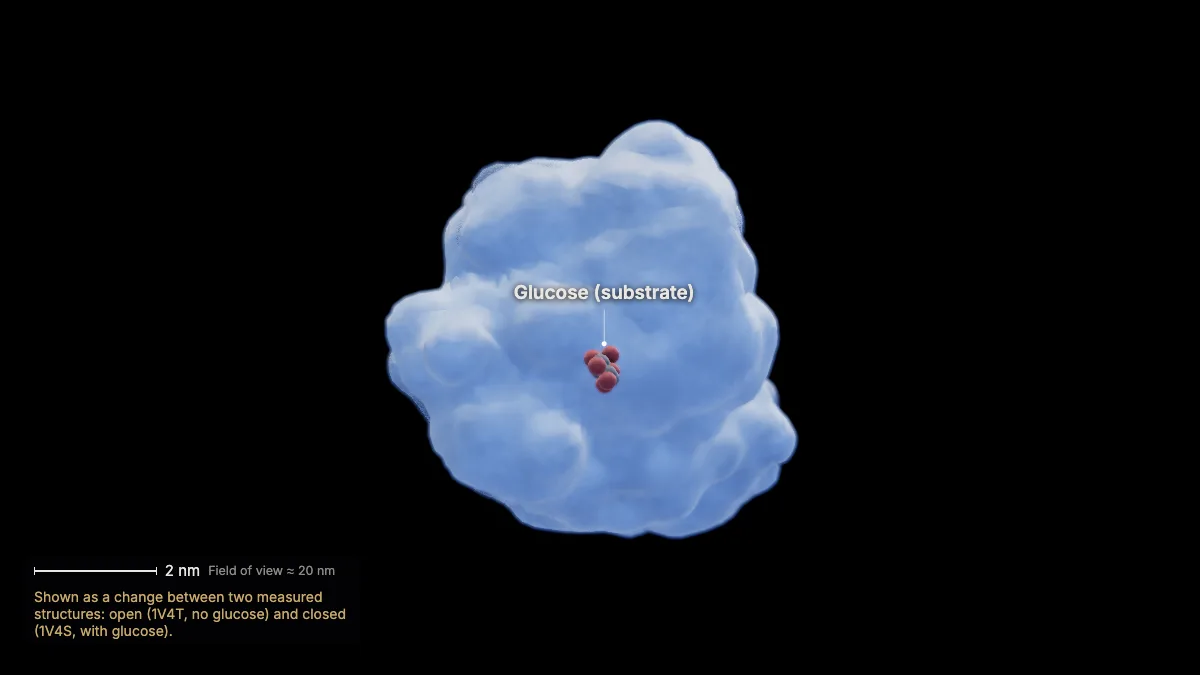
Binding changes the enzyme's shape: glucokinase closes around glucose. This is induced fit — a refinement of the lock-and-key model.
Here the change is large: parts of the enzyme move by up to 4 nm as its domains rearrange.
- Largest shift≈ 39 Å
In the model: Shown as a change between two measured structures: open (1V4T, no glucose) and closed (1V4S, with glucose).
5The reaction — and the enzyme is reused
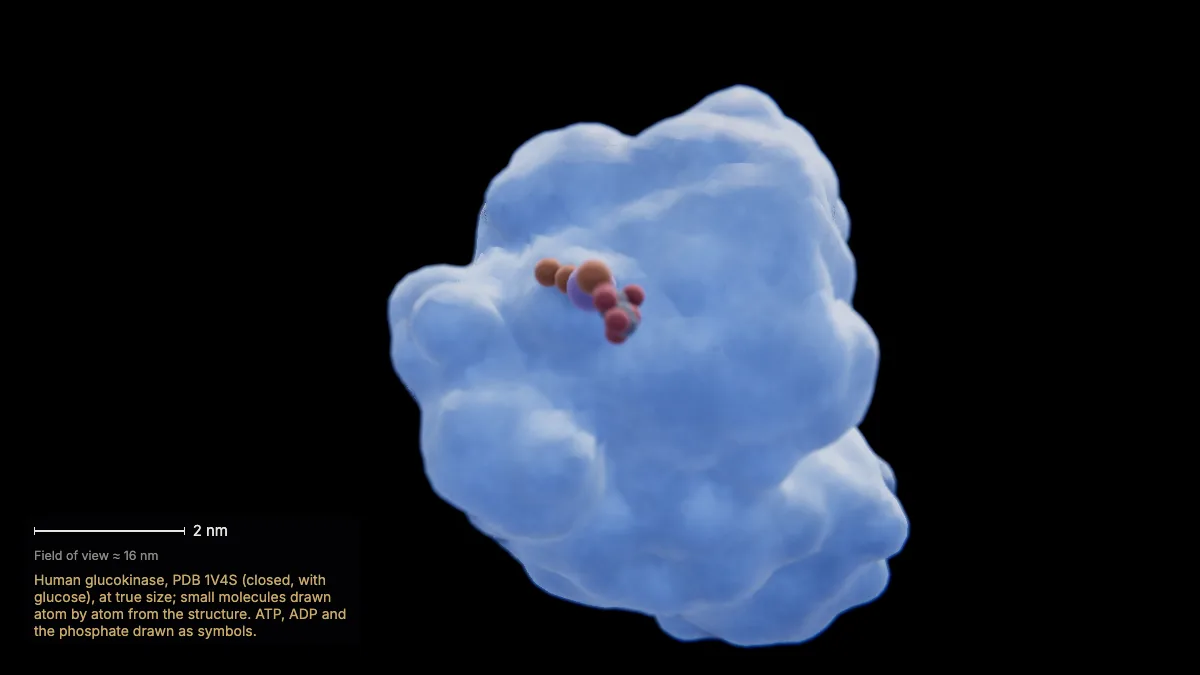
In the complex, ATP's phosphate is moved onto glucose; the product, glucose 6-phosphate, is released.
Enzymes help by holding substrates in the right orientation, giving the right chemical environment, and straining bonds toward the transition state.
The enzyme itself is unchanged and is free to bind the next glucose.
In the model: Human glucokinase, PDB 1V4S (closed, with glucose), at true size; small molecules drawn atom by atom from the structure. ATP, ADP and the phosphate drawn as symbols.
Temperature, pH and concentration
6Temperature
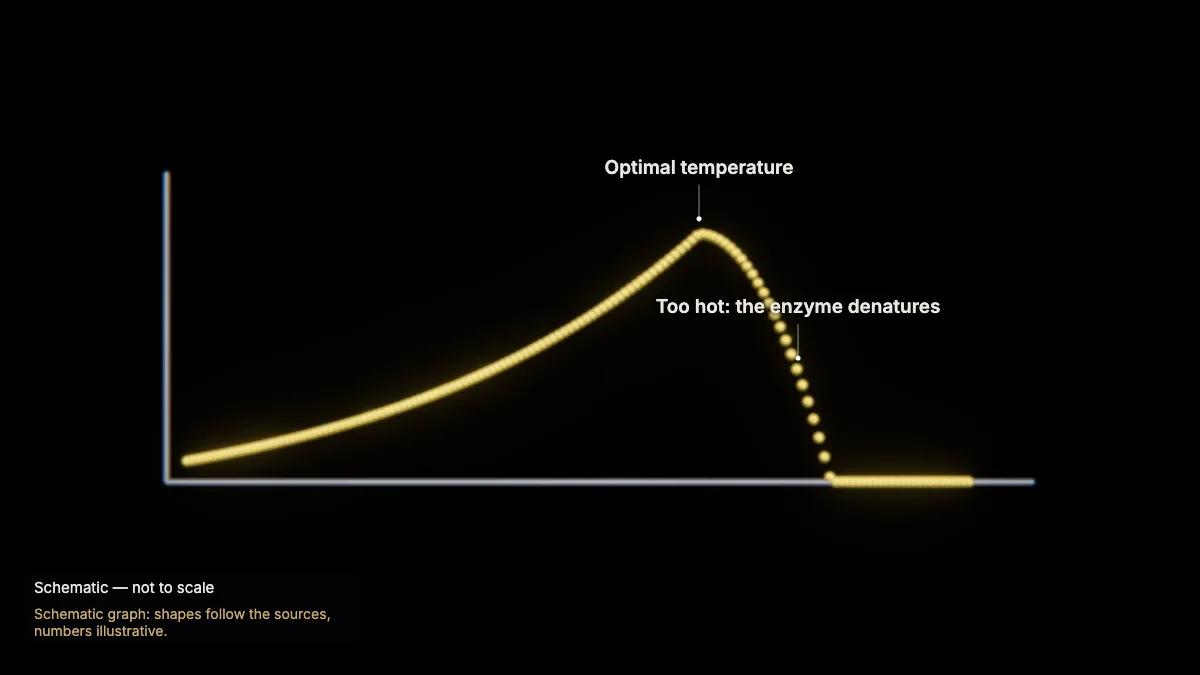
Warmer molecules move faster and collide more often, so the rate rises — up to the optimal temperature. Beyond it, the rate falls.
Too much heat disrupts the hydrogen bonds that hold the enzyme in shape.
In the model: Schematic graph: shapes follow the sources, numbers illustrative.
7pH
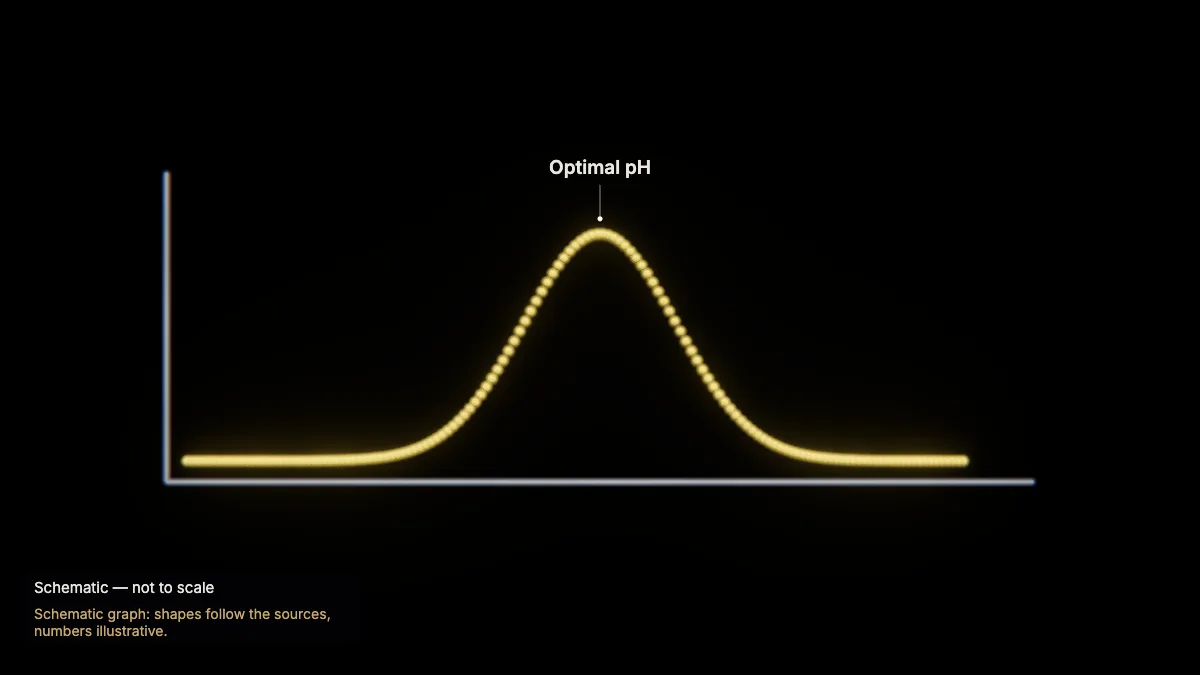
Each enzyme works best in a certain pH range. Outside it, the enzyme's shape — and its active site — changes, and it works less well.
In the model: Schematic graph: shapes follow the sources, numbers illustrative.
8Denaturation
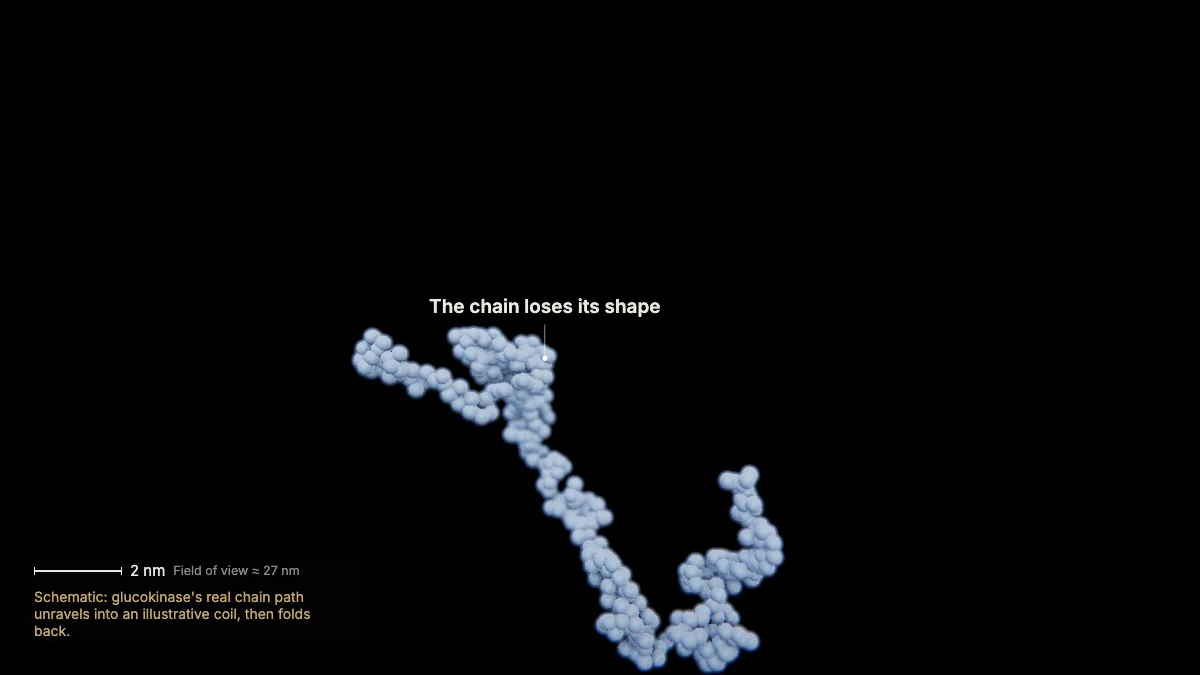
Extreme temperature, pH or chemicals can disrupt the enzyme's structure — denaturation — and it can no longer catalyze its reaction.
In some cases denaturation is reversible, and the enzyme folds back and regains its activity.
In the model: Schematic: glucokinase's real chain path unravels into an illustrative coil, then folds back.
9Substrate concentration
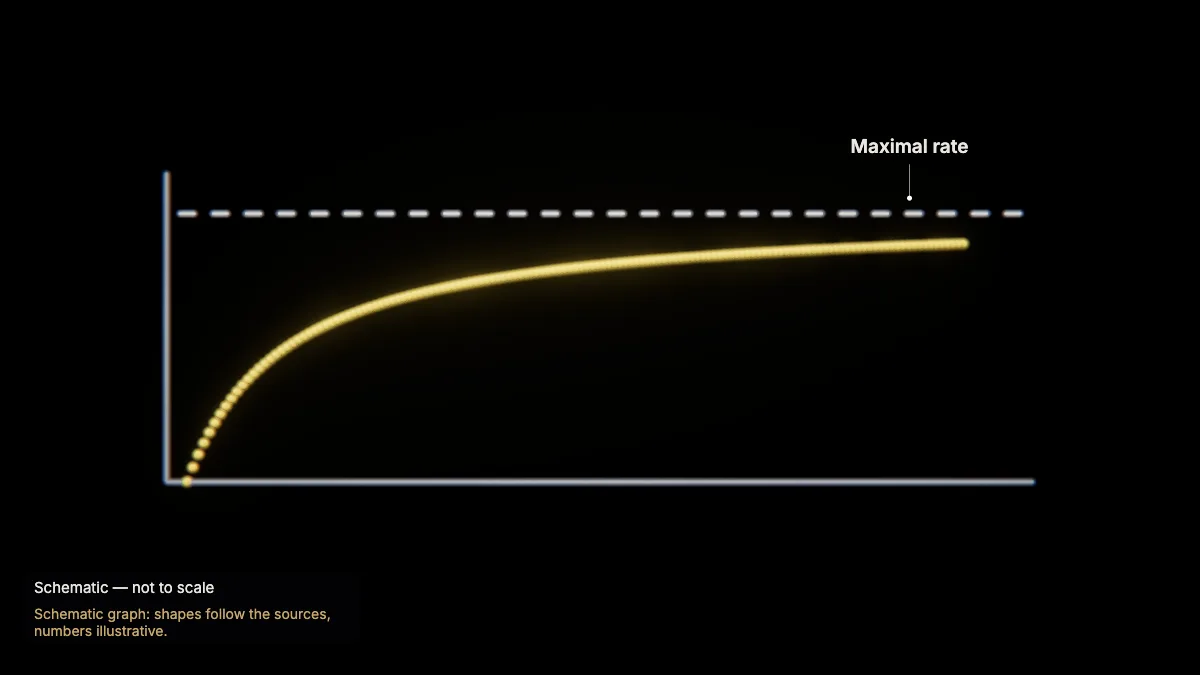
As the substrate concentration rises, the reaction rate rises too — up to a maximal rate.
The relative amounts of substrates and products set how efficiently an enzyme's reaction proceeds.
In the model: Schematic graph: shapes follow the sources, numbers illustrative.
Inhibition and regulation
10Competitive inhibition: statins
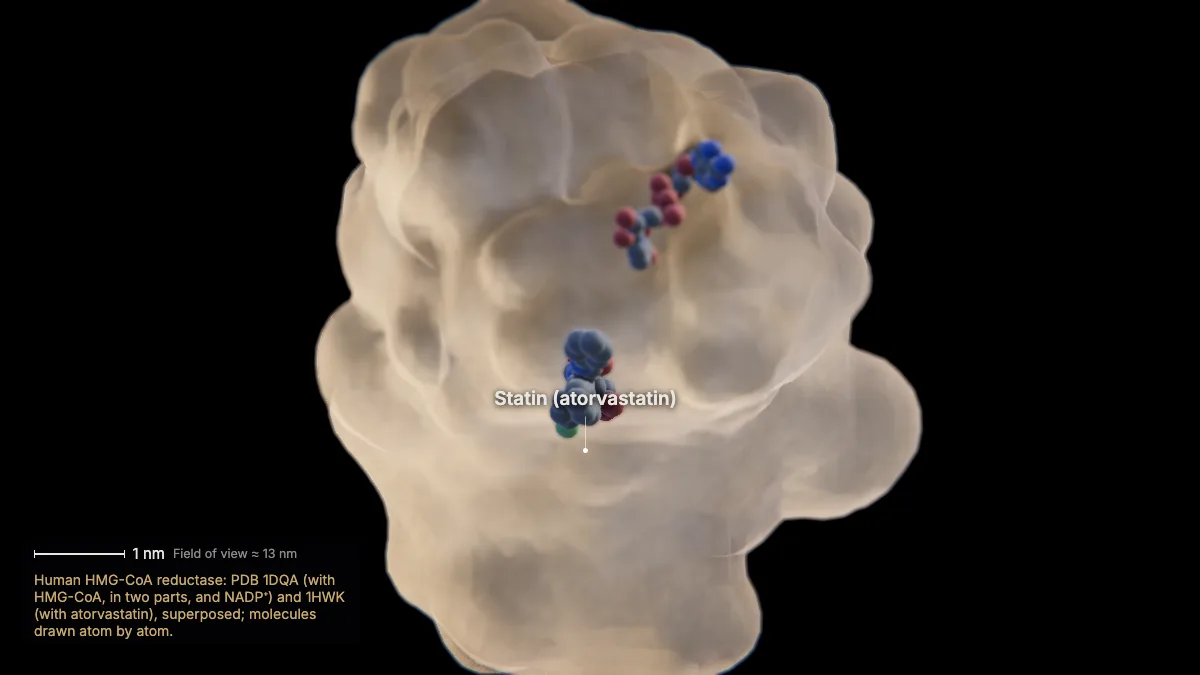
A competitive inhibitor binds in the active site and blocks the substrate. Statins, which lower cholesterol, do this to HMG-CoA reductase.
Shown here: the substrate, HMG-CoA, in the active site of the human enzyme — then a statin, atorvastatin, from another structure of the same enzyme, filling part of the same site.
- HMG-CoA reductase (catalytic part)≈ 7 nm
In the model: Human HMG-CoA reductase: PDB 1DQA (with HMG-CoA, in two parts, and NADP⁺) and 1HWK (with atorvastatin), superposed; molecules drawn atom by atom.
11Allosteric regulation
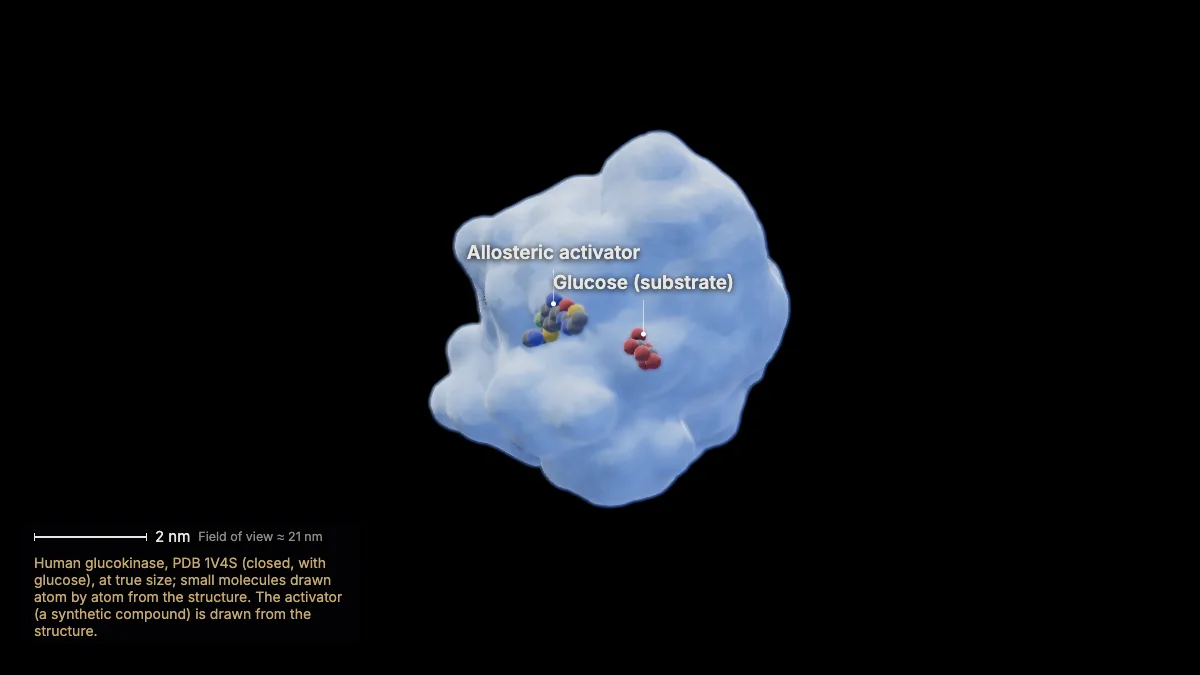
Some molecules bind away from the active site, at an allosteric site, and change the enzyme's activity. This one, found in a glucokinase structure, activates it.
Allosteric activators increase the active site's affinity for its substrate; allosteric inhibitors decrease it.
- Activator to glucose≈ 2 nm
In the model: Human glucokinase, PDB 1V4S (closed, with glucose), at true size; small molecules drawn atom by atom from the structure. The activator (a synthetic compound) is drawn from the structure.
12How inhibitors change the rate
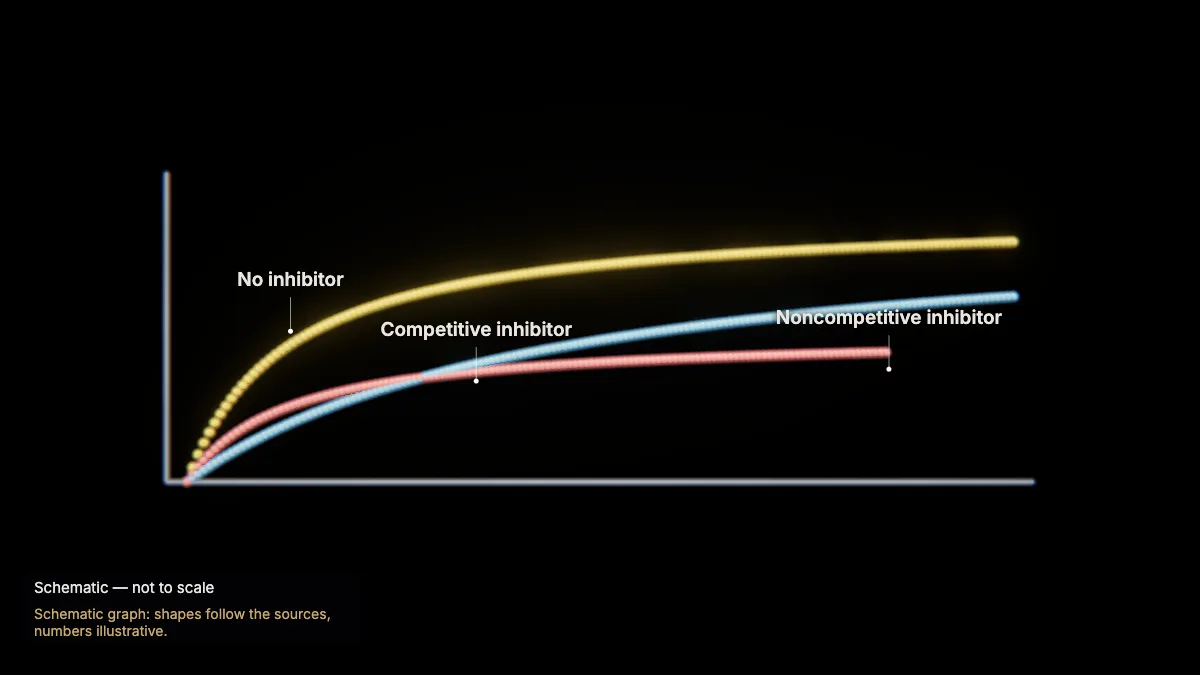
A competitive inhibitor slows the reaction at low substrate levels, but enough substrate still reaches the maximal rate. A noncompetitive inhibitor lowers the maximal rate.
Noncompetitive inhibitors bind at an allosteric site and change the enzyme so it works less well.
In the model: Schematic graph: shapes follow the sources, numbers illustrative.
13Feedback inhibition
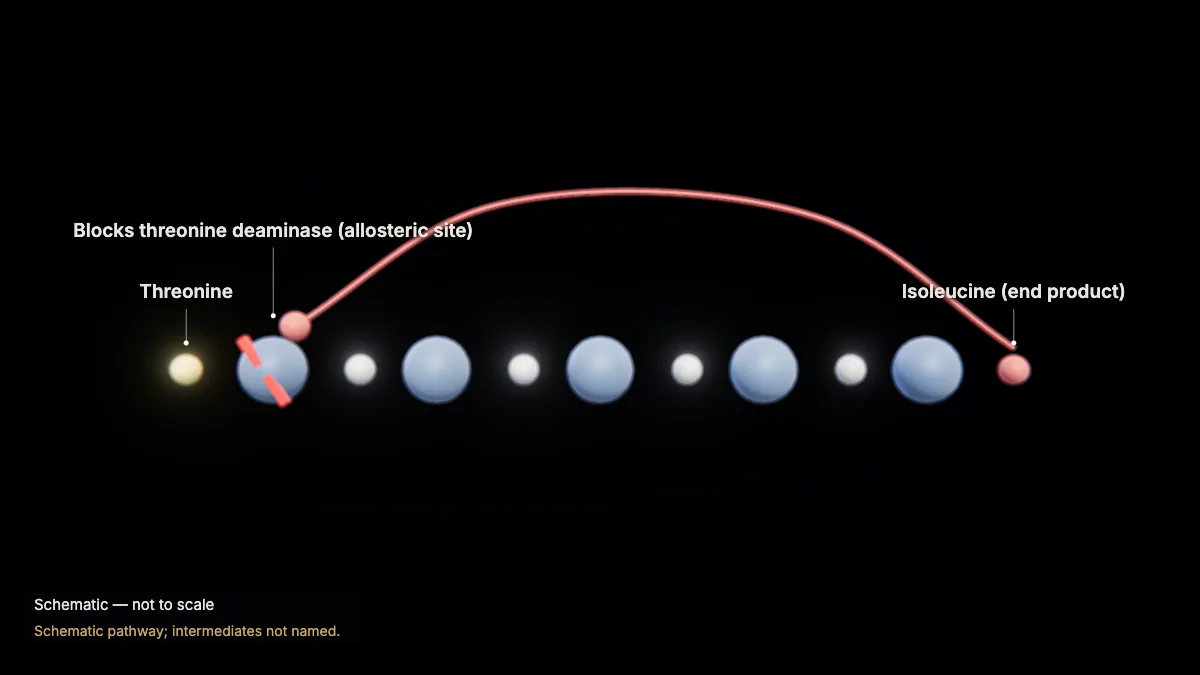
In a pathway, the product of one reaction is the reactant of the next. The end product can switch off an early enzyme: feedback inhibition.
Isoleucine, for example, binds the allosteric site of threonine deaminase, early in its own pathway, and blocks threonine until isoleucine levels fall.
Likewise, ATP inhibits — and ADP activates — some enzymes of sugar breakdown.
In the model: Schematic pathway; intermediates not named.
14Cofactors and coenzymes
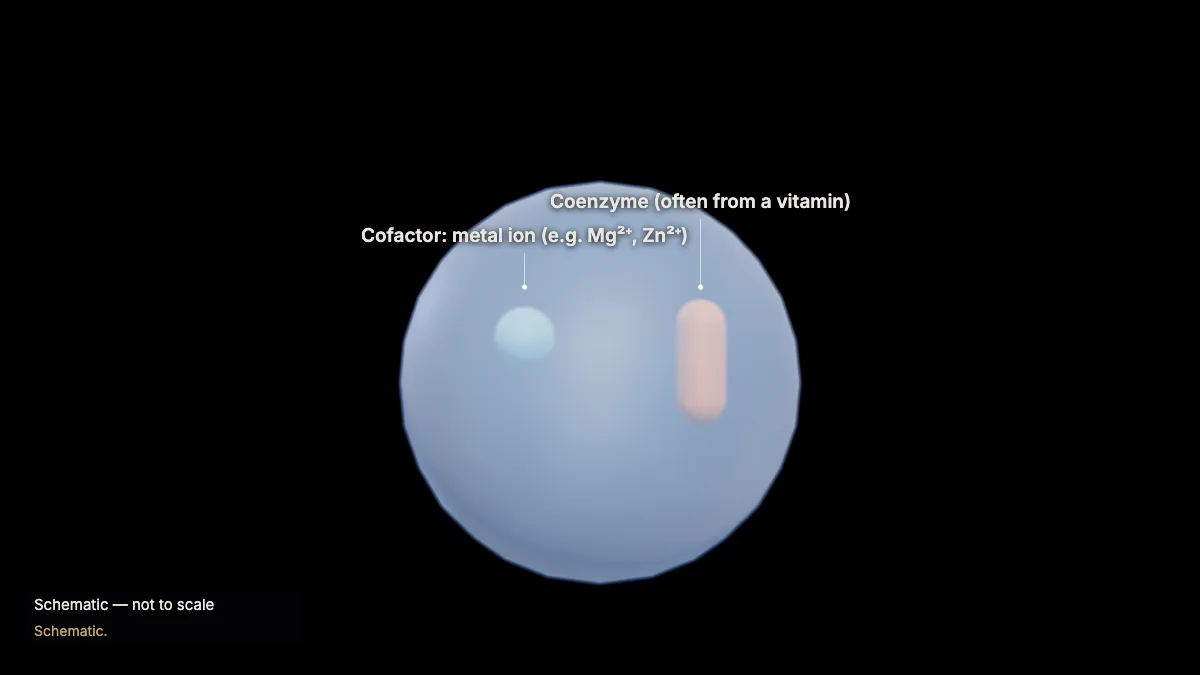
Many enzymes need helpers: cofactors, inorganic ions such as Mg²⁺, Fe²⁺ or Zn²⁺, and coenzymes, organic molecules often made from vitamins.
DNA polymerase, for instance, needs a bound zinc ion; vitamin C is a coenzyme for enzymes that build collagen.
In the model: Schematic.
For teachers
This chapter covers AP Biology Topics 3.1 and 3.2 (enzymes and environmental impacts on enzyme function) and the sequential pathways of Topic 3.3.
- Project the 3D model and go step by step, with labels and an English voice-over you can turn on or off.
- Checkpoints pause the lesson for a question: predict before a step, or check after it.
- Record a lesson video right from the page, or export an MP4.
- Simplifications are stated on screen, and the scale bar is measured from the actual view.
Chapter 1, the tour of the cell, is free for everyone, and a free account also opens cellular respiration and photosynthesis. The Teacher plan adds the other chapters — transcription, translation, protein folding and secretion, the cell cycle and mitosis, meiosis, cell communication, and enzymes — plus worksheet answer keys and 4K video exports without a watermark: $29 a year during early access (regular price $69).
What the model simplifies
- Glucokinase's change of shape is shown as a change between two measured structures (open and closed), not as a simulated motion.
- Small molecules are drawn atom by atom from the structures; in the active-site view the surface is cut away and the lining amino acids are drawn atom by atom. ATP, ADP and phosphates in the reaction are symbols.
- Denaturation is a schematic: the chain's real path unravels into an illustrative coil.
- The energy and rate graphs are schematic: their shapes follow the sources, the numbers are illustrative.
Sources
- OpenStax, Biology 2e, §6.2 Potential, Kinetic, Free, and Activation Energy — openstax.org
- OpenStax, Biology 2e, §6.5 Enzymes — openstax.org
- College Board, AP Biology Course and Exam Description, Topics 3.1–3.3 — apcentral.collegeboard.org
- Kamata et al., Structural basis for allosteric regulation of the monomeric allosteric enzyme human glucokinase, Structure 12 (2004) — doi.org
- Istvan & Deisenhofer, Structural mechanism for statin inhibition of HMG-CoA reductase, Science 292 (2001) — doi.org
- UniProt P35557 (glucokinase); Protein Data Bank 1V4S, 1V4T, 1DQA, 1HWK — uniprot.org